Better forecasts.Less planning effort.

Turn your business data into reliable forecasts and clearer planning decisions. Create your first forecast in 3 minutes!

Brownie-Sales
All changes saved
Targets5Covariates1
Daily frequency
Jun 10
Jun 11
Jun 12
Jun 13
Jun 14
Jun 15
Jun 16
Jun 17
Jun 18
Jun 19
Jun 20
Jun 21
Jun 22
Jun 23
Jun 24
Jun 25
Jun 26
Jun 27
Jun 28
Jun 29
Jun 30
Jul 01
Jul 02
Jul 03
Jul 04
Jul 05
Jul 06
Jul 07
Jul 08
Jul 09
Jul 10
Jul 11
Jul 12
Jul 13
Jul 14
Jul 15
Jul 16
Jul 17
Jul 18
Jul 19
Jul 20
Jul 21
Jul 22
Jul 23
Jul 24
Jul 25
Jul 26
Jul 27
Jul 28
Jul 29
Jul 30
Jul 31
Aug 01
Aug 02
Aug 03
Aug 04
Aug 05
Aug 06
Aug 07
Aug 08
Aug 09
Aug 10
Aug 11
Aug 12
Aug 13
Aug 14
Aug 15
Aug 16
Aug 17
Aug 18
Aug 19
Aug 20
Aug 21
Aug 22
Aug 23
Aug 24
Aug 25
Aug 26
Salty peanut
52
56
63
66
60
52
50
52
55
60
62
56
47
44
47
51
55
57
53
45
42
45
51
56
58
55
50
46
50
58
64
65
63
58
53
55
62
67
66
61
55
49
49
55
61
59
53
49
45
46
52
61
61
55
52
50
51
57
66
68
White chocolate
41
46
53
53
48
44
41
41
45
51
51
45
40
38
38
41
47
48
42
37
36
37
40
46
49
44
39
40
43
46
53
56
52
46
44
47
49
53
55
50
43
39
42
45
48
50
46
40
36
39
44
48
49
47
42
39
42
48
53
54
Caramel
36
40
43
45
42
37
34
36
40
44
43
40
36
31
32
37
40
39
36
32
29
30
35
41
41
38
36
34
35
41
47
47
43
40
38
38
41
47
47
41
37
36
35
38
43
44
39
34
33
34
36
42
44
39
34
34
37
40
45
48
Strawberry
22
25
30
32
28
24
24
26
28
33
35
32
27
27
29
31
35
37
34
29
27
30
33
36
38
35
31
28
30
33
36
36
34
29
25
27
31
33
33
31
27
24
25
30
33
33
30
27
24
24
29
33
32
29
27
25
26
30
36
36
Matcha
17
21
24
24
22
20
19
19
23
27
27
24
22
21
21
24
28
29
25
23
23
23
25
30
31
27
24
23
23
25
28
29
25
21
21
22
23
26
28
25
21
20
21
23
25
27
24
20
18
20
23
25
26
25
21
20
22
25
28
28
Temperature (°C)
Today
History horizon
Forecast horizon
Prediction viewSalty peanut
Forecast ready
HistoryPrediction80% interval
Forecast impact with
25% fewer stockouts
Production plan in 2 min
6% higher revenue
15h planning time saved weekly
Powerful prediction models
No-code workflow
Easy forecast automation
High data privacy standards
Current planning issues

Turn complex forecasting work into a clear workflow.

The hard part is not having data. It is turning tedious, mathematically complex forecasting work into a repeatable workflow that people can actually run and explain.

Excel turns every forecast update into manual work

Each update means copying exports, correcting columns, and reconciling versions—creating extra work and opportunities for errors.

Forecasting know-how is hard to share

When model choices and settings live with one specialist, the rest of the team cannot easily repeat or audit the process.

BI systems report the past, but do not build the forecast

Reporting explains what happened. A reliable forecast still requires selecting variables and models and testing the result—often across separate steps.

Typical manual forecasting workflow

Data sources
SAPOdooShopifyMicrosoft Dynamics
ExcelCombine data in Excel
Build the forecast
Postprocessing
Make a decision

TelAIscope workflow

Data sources
SAPOdooShopifyMicrosoft DynamicsMicrosoft Excel
TelAIscope
Make a decision
Connection to operating decisions

From a forecast to a clearer operating decision.

A forecast is useful when it tells someone what to do next. TelAIscope keeps expected demand, relevant context, and uncertainty visible in one place.

Free more capital

More precise forecasts reduce the need to protect against uncertainty with excess inventory.

Protect service levels

Spot demand pressure earlier and reduce avoidable out-of-stock situations.

Reduce operational effort

Replace repeated reconciliation with a planning view the whole team can use.

Waste less

Plan production and replenishment more closely to expected demand.

A simple example workflow: import existing tables, define the variables, evaluate the forecast, and carry a clear result into planning.

01
SAPOdooShopifyMicrosoft DynamicsMicrosoft Excel

Connect data

Bring in existing tables without building a data pipeline first.

02

Define the variables

Select target variables and covariates, then set frequency and horizon.

03

Evaluate the forecast

Compare methods and see uncertainty before trusting the result.

04

Make decisions

Visualize and share the forecast result as a clear basis for the next decision.

A forecasting workbook your team can actually use.
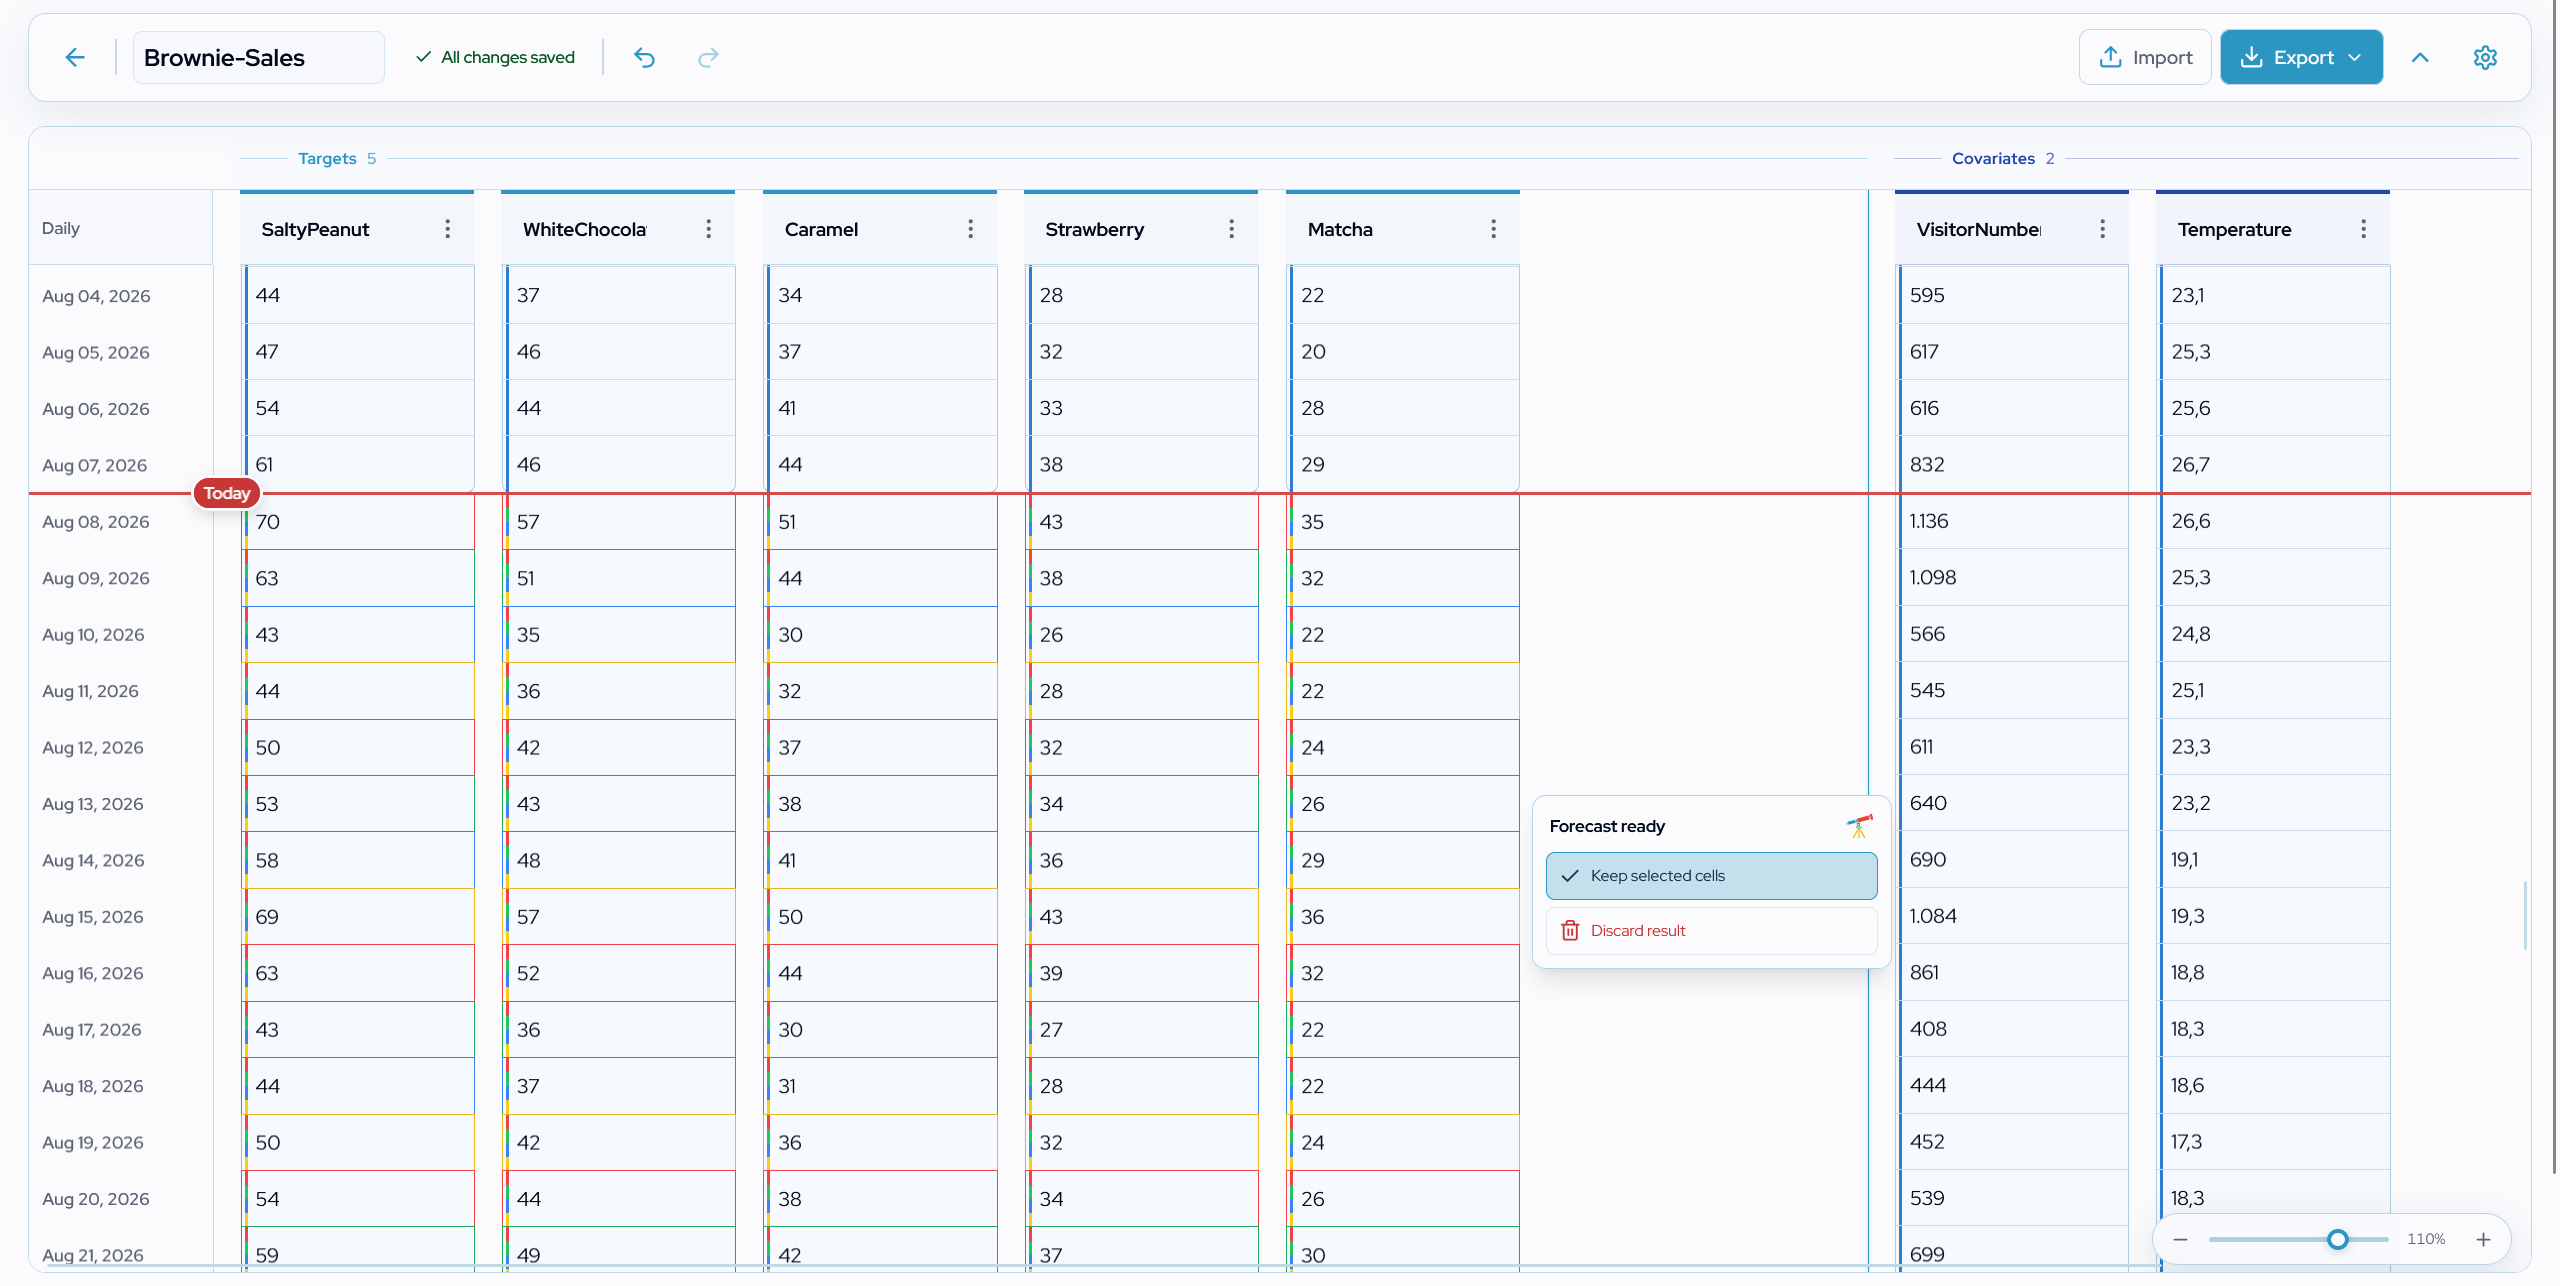
Select one or more target variables
Add covariates that influence the target variables
Visualize the forecast result with charts
Explore the product
TelAIscope workbook showing target variables and covariate columns
A forecast-based workbook for practical planning.
Use cases

One forecasting workflow. Many planning questions.

Technology

The right level of intelligence for the pattern in front of you.

  • TSFMs as today's strongest forecasting models
  • Machine learning to select variables and parameters
  • Statistical baselines for transparent comparison
  • Backtesting to make model choice evidence-led
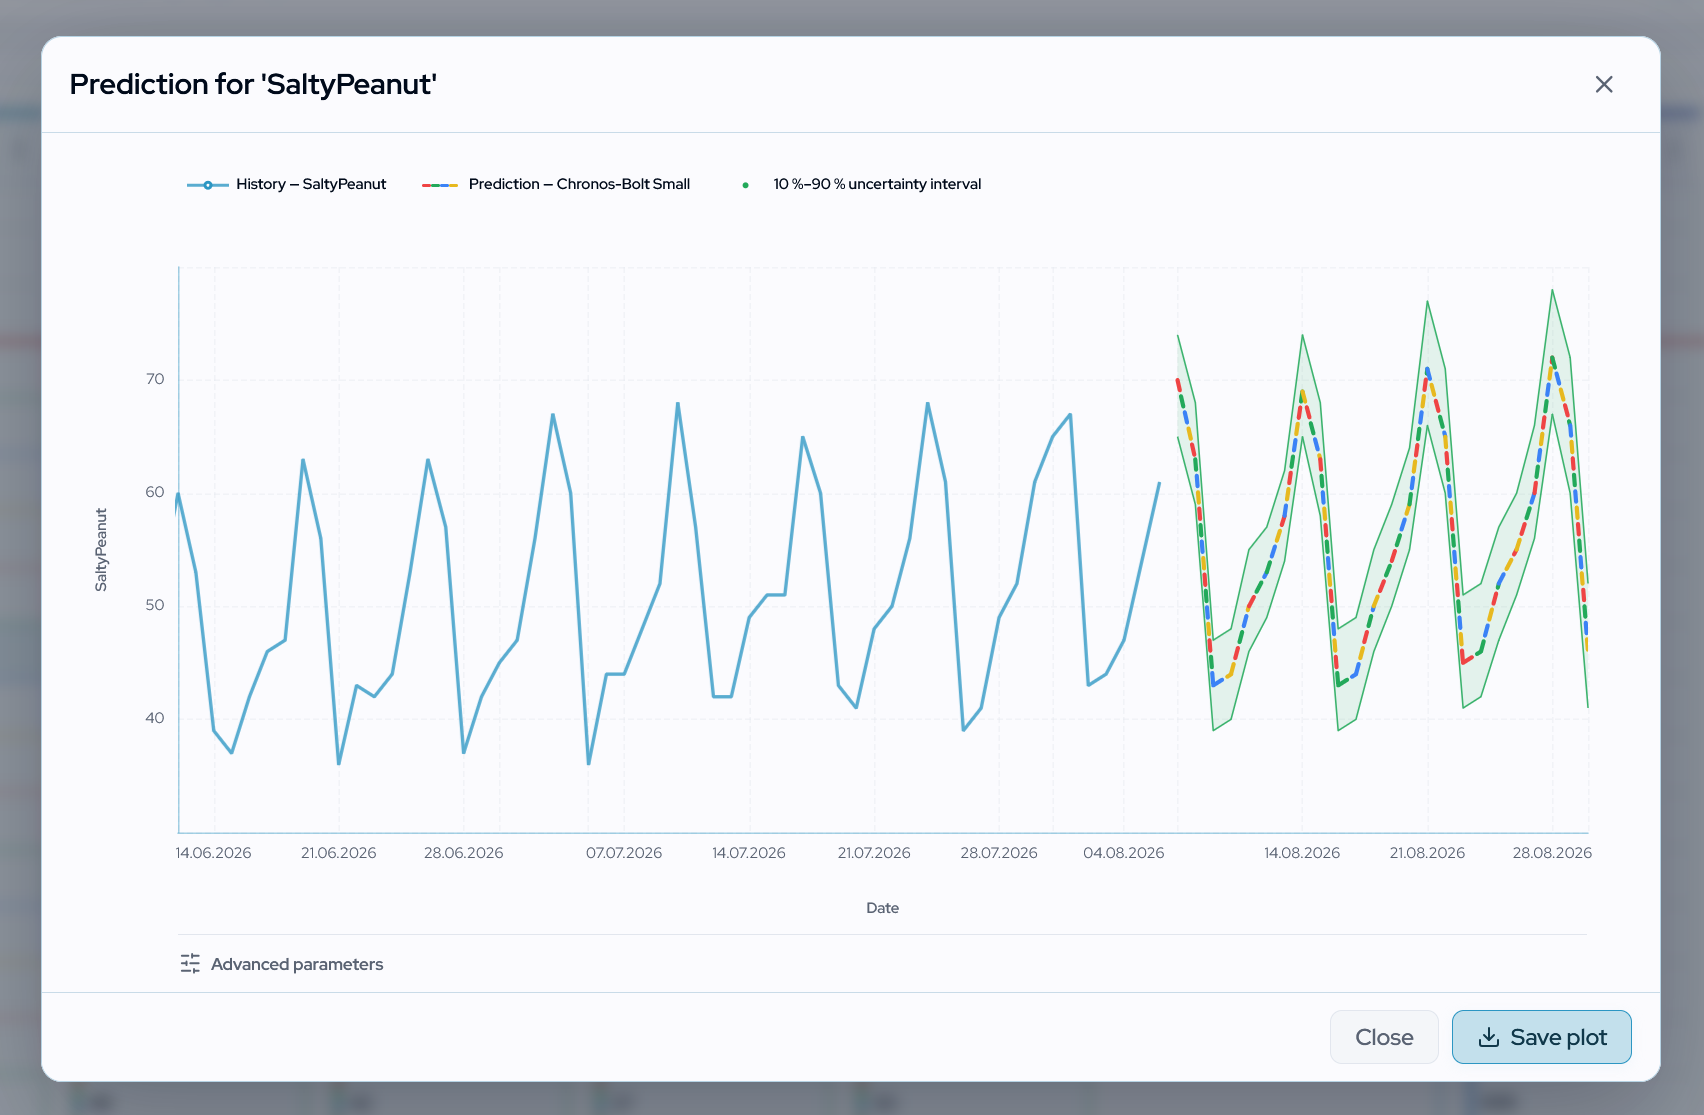
Explore the technology
TelAIscope forecast plot showing historical values and a prediction range
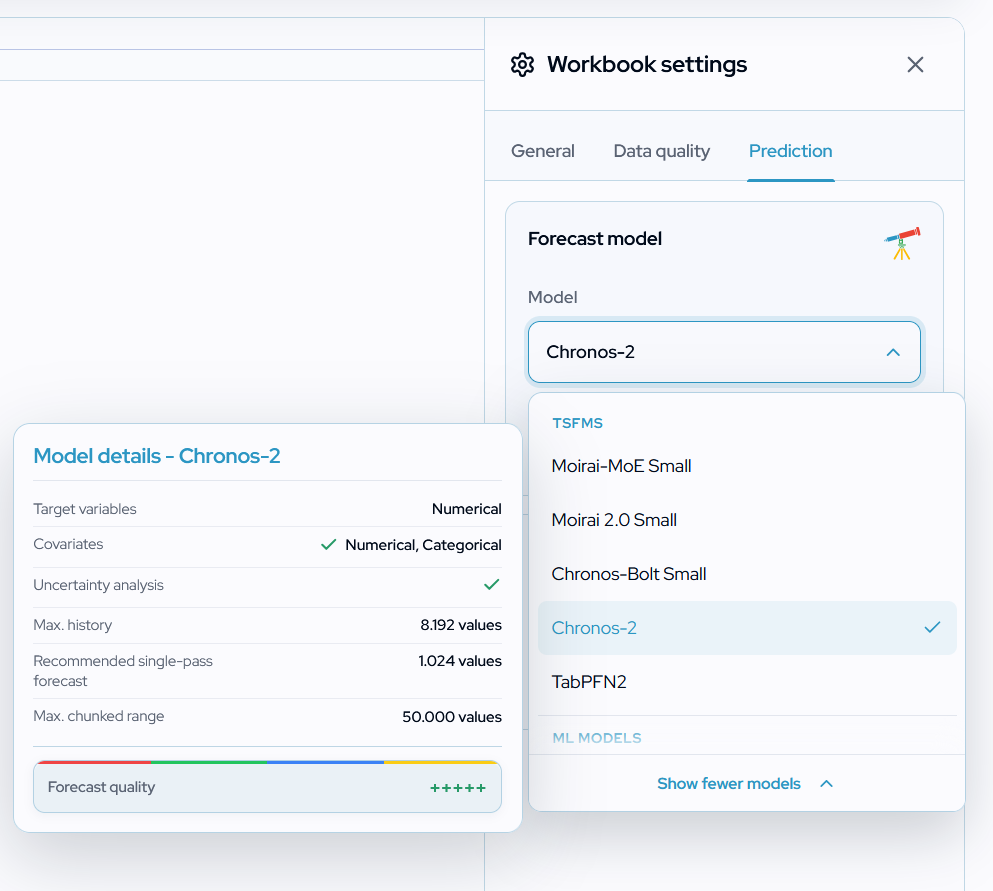
TelAIscope model selection panel showing forecasting model categories
European Union flag representing data protection
European data protection
Data protection and trust

Strict data privacy and GDPR compliance

TelAIscope is built for responsible forecasting with the privacy, security, and governance standards European teams expect.

GDPR-compliant handling of personal and business data
Hosting your data 100% on servers in the EU
Designed for EU GDPR and AI Act expectations
No training of AI models with your data
Start with one time series

Turn your data into better decisions.

Import your data and create your first forecast with TelAIscope.